The Relationship Between Photovoltaic Output Power and Temperature, Light Intensity, and Angle
The Relationship Between Photovoltaic Output Power and Temperature, Light Intensity, and Angle
The output power of a photovoltaic (PV) power station is closely related to temperature, light intensity, and the installation angle of the modules. The specific relationships are as follows:
1. Temperature and Output Power
Negative correlation: As temperature increases, the output power of PV modules decreases.
· Temperature coefficient of mainstream crystalline silicon PV modules: Approximately -0.38% to -0.44%/°C, meaning that for every 1°C increase, power generation decreases by about 0.38%.
· Impact on module performance:
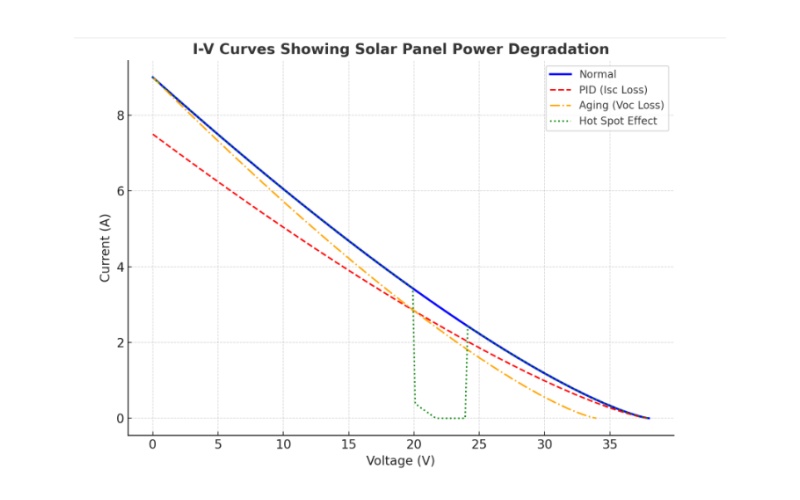
o Short-circuit current (Isc) remains almost unchanged.
o Open-circuit voltage (Voc) decreases, leading to reduced output power.
o At an operating temperature of 85°C, efficiency decreases by ~22% compared to the standard 25°C condition.
2. Light Intensity and Output Power
Positive correlation: The maximum power output of PV cells increases with light intensity.
· Linear relationship (within a certain range):
o Higher light intensity allows PV cells to absorb more photons, increasing power output.
o Beyond a certain threshold, power output may saturate due to material limitations.
3. Angle and Output Power
Tilt Angle (Optimal Inclination)
· The optimal tilt angle maximizes solar radiation absorption based on geographical location and climate conditions.
· General rule: The tilt angle should match the local latitude.
o Example: In Beijing (39°56′ N), the optimal tilt angle is ~39°, with an azimuth angle of 0° (due south).
Seasonal Variations
· Lower tilt angles favor summer power generation (higher sun position).
· Higher tilt angles favor winter power generation (lower sun position).
· A compromise angle is often chosen to maximize annual energy yield, typically resulting in peak generation in spring and autumn.
Summary Table
Factor | Relationship with Output Power | Key Observations |
Temperature | Negative correlation | - Power decreases by ~0.38%/°C- 85°C reduces efficiency by ~22% vs. 25°C |
Light Intensity | Positive correlation | - Near-linear increase until saturation- Higher irradiance = higher power output |
Tilt Angle | Optimal angle maximizes power | - Best angle ≈ local latitude- Adjustments needed for seasonal variations |
Conclusion
The performance of PV systems is significantly influenced by temperature, light intensity, and module angle. Proper temperature management, optimal tilt angle selection, and consideration of irradiance levels are crucial for maximizing power output and efficiency.