Solar Panel Power Degradation: Diagnosis with I-V Curve Testing
Solar Panel Power Degradation: Diagnosis with I-V Curve Testing
Solar panels, like the beating hearts of a PV system, continuously convert sunlight into usable electricity. Over time, however, performance may decline due to solar panel power degradation, directly affecting system efficiency and return on investment. To detect and quantify this decline, I-V curve testing is the industry’s most powerful diagnostic tool—an “electrocardiogram” for PV modules.
I. Understanding the I-V Curve
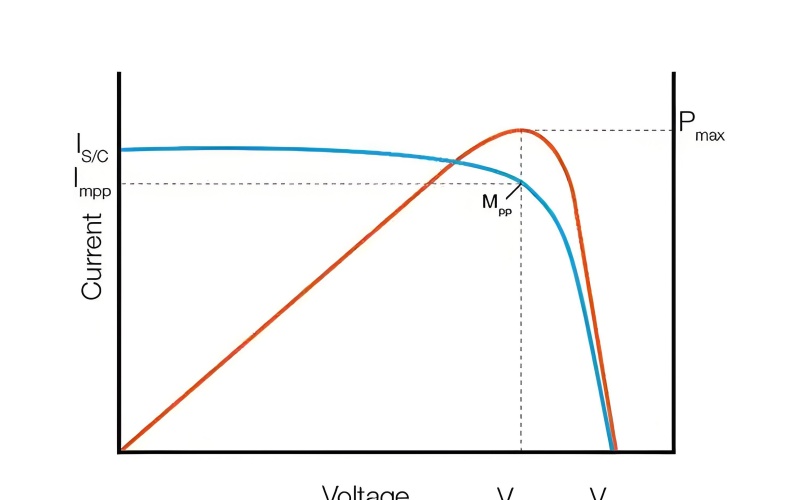
The I-V curve illustrates the relationship between a module’s output current (I) and voltage (V). Key parameters include:
Parameter | Definition | Diagnostic Value |
Voc (Open-Circuit Voltage) | Max voltage at zero current | Indicates junction quality and material aging |
Isc (Short-Circuit Current) | Max current at zero voltage | Reflects illumination and active cell area |
MPP (Maximum Power Point) | Point of highest I×V product | Defines real usable output power |
FF (Fill Factor) | Curve “squareness” (Pmax / Voc × Isc) | Lower FF suggests resistance or leakage issues |
II. Mechanisms of Power Degradation
> Several physical and environmental factors contribute to solar panel power degradation:
> Light-Induced Degradation (LID): Efficiency drop in new modules due to boron-oxygen complexes.
> Potential-Induced Degradation (PID): Caused by high voltage stress and ion migration.
> Aging Effects: Encapsulant yellowing, corrosion of metallization, material fatigue.
> Hot Spot Damage: Local overheating from shading or defective cells.
> Environmental Stressors: UV exposure, acid rain, abrasion, humidity.
> Microcracks & Broken Fingers: Reduce carrier collection efficiency.
III. Typical I-V Curve Signatures of Degradation
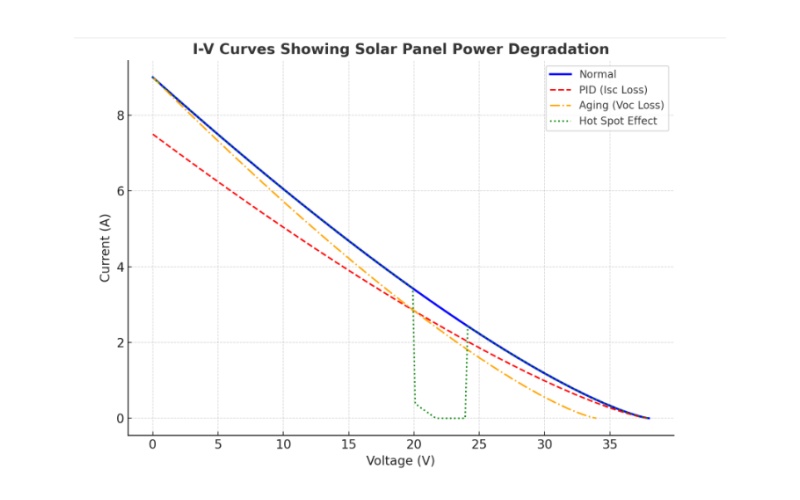
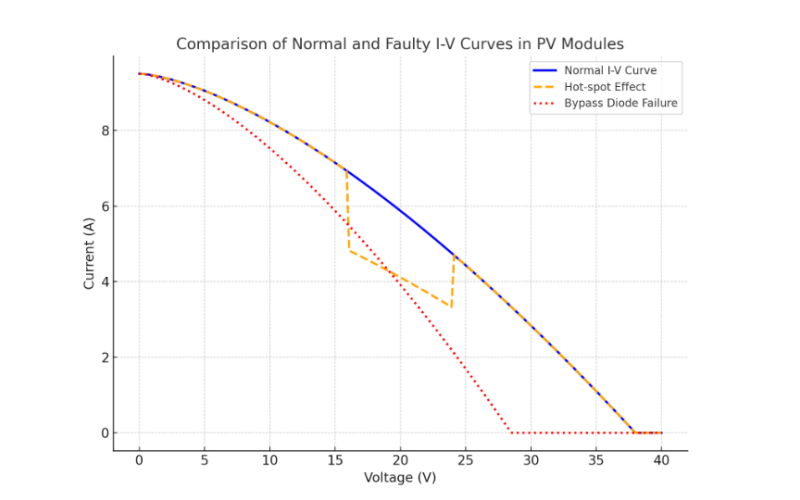
Degradation leaves “fingerprints” on the I-V curve:
I-V Signature | Possible Cause |
Isc Reduction | PID, soiling, microcracks, efficiency loss |
Voc Reduction | Material aging, encapsulant failure, PID |
Low Fill Factor | Series resistance increase, shunt resistance loss |
Steps or Kinks | Hot spots, bypass diode failure, broken fingers |
Curve Collapse | Severe cracks, shading, or cell string failure |
IV. Diagnostic Workflow
1. Standardized Measurement
>> Use a calibrated I-V curve tracer under STC (1000W/m², AM1.5, 25°C) or apply corrections.
>> Ensure modules are clean and unshaded.
1. Data Comparison
>> Overlay current I-V curve with factory reference curve.
>> Calculate Power Degradation Rate:

2. Parameter-Based Check
>> Compare Voc, Isc, MPP, and FF against rated values.
>> Significant deviation indicates degradation.
3. Complementary Diagnostics
>> EL Imaging: Pinpoint microcracks or inactive cells.
>> IR Thermography: Detect hot spots or abnormal heating.
V. Application in PV Asset Management
I-V curve–based degradation diagnosis supports:
>> Performance Monitoring: Quantify real-time module status.
>> Root Cause Identification: Determine if underperformance is due to PID, cracks, or external stress.
>> Quality Control: Validate module quality on delivery or post-installation.
>> O&M Strategy: Identify weak modules before they affect string output.
>> Asset Valuation: Provide objective data for PV plant transactions.
Conclusion
The I-V curve serves as an open diagnostic logbook of every PV module. By learning to interpret its shifts, contractions, or distortions, engineers and asset managers can detect solar panel power degradation early, minimize energy yield losses, and extend system lifetime. Just as regular medical checkups safeguard human health, scheduled I-V curve testing ensures the vitality and investment value of solar PV assets.