Relationship Between Photovoltaic Module Voltage, Current, Power, and Irradiance
Relationship Between Photovoltaic Module Voltage, Current, Power, and Irradiance
The electrical characteristics of photovoltaic (PV) modules are primarily determined by voltage (V), current (I), power (P), and irradiance (G). Their interrelationships can be analyzed using I-V and P-V characteristic curves.
1. Core Parameter Relationships
Parameter | Definition | Influencing Factors | Typical Variation Pattern |
Short-circuit current (Isc) | Output current at V=0 | Irradiance (G) | Approximately proportional to G |
Open-circuit voltage (Voc) | Output voltage at I=0 | Temperature (T), cell material | Decreases with rising T, minimally affected by G |
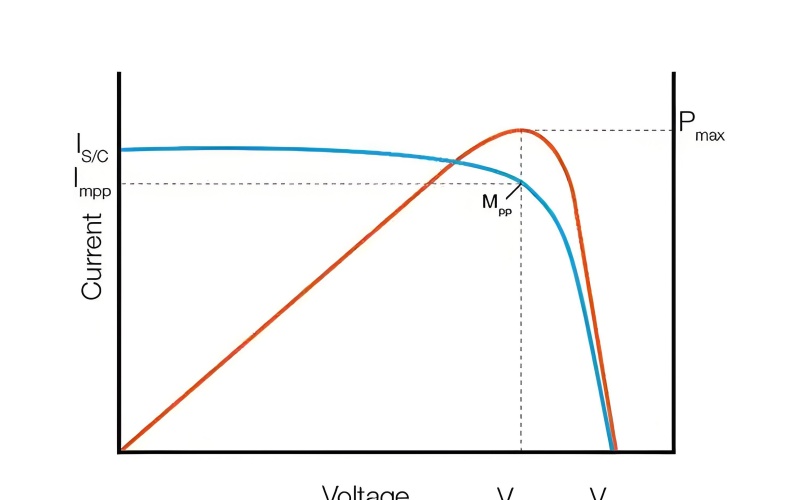
Maximum power point (MPP) | Peak point on P-V curve | G, T, shading | Vmp and Imp increase nonlinearly with G |
Output power (P) | P = V × I | G, T, MPPT control | Increases with G but efficiency drops at high T |
2. Key Relationships Explained
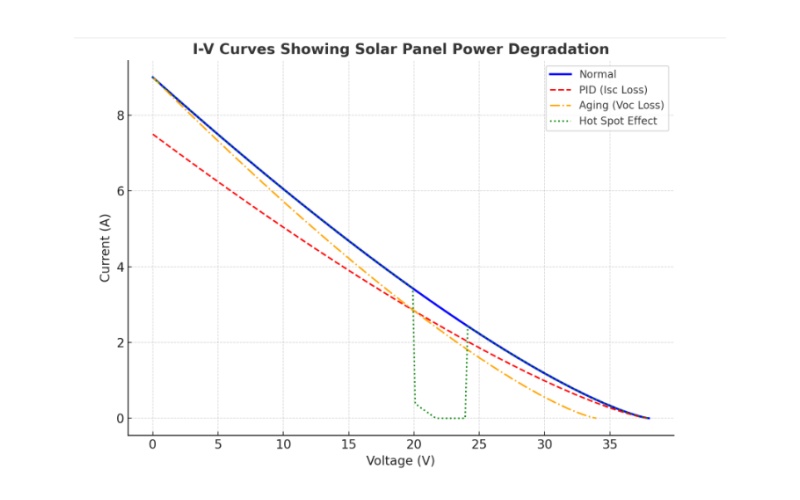
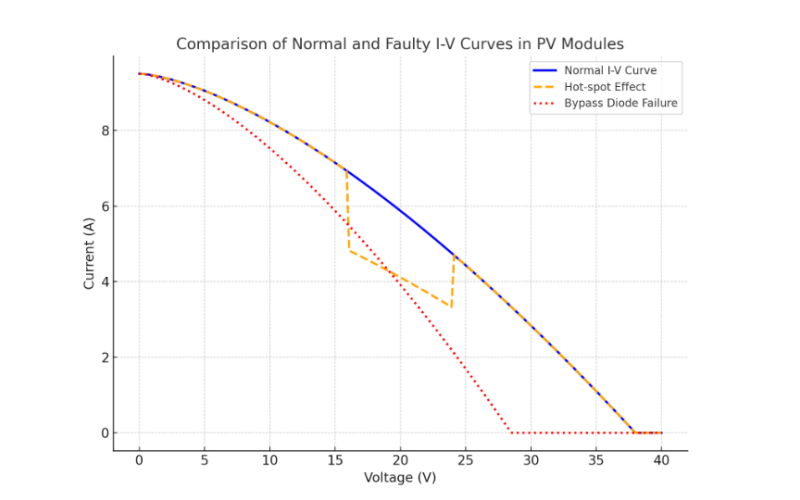
I-V Curve: Reflects current variation under different voltages, with Voc and Isc as boundary values.
P-V Curve: The power peak (MPP) is critical for system efficiency and requires dynamic tracking via MPPT technology.
Irradiance Impact: For every 200 W/m² increase in G, Isc grows nearly linearly, while Vmp increases only slightly (experimental data).
Temperature Impact: For every 1°C rise in T, Voc decreases by ~0.3%–0.5%, causing a 0.4%–0.5% power loss (Si-based modules).
3. Optimization Recommendations
In practical applications, MPPT algorithms should compensate for fluctuations in G and T while avoiding power mismatch due to partial shading.