Solar Cells IV Characteristic Curve: Current-Voltage Relationship
Solar Cells IV Characteristic Curve: Current-Voltage Relationship, Key Parameters, and Testing Mechanisms
1. Core Value of IV Characteristic Curve
The IV characteristic curve of photovoltaic (PV) cells is a fundamental tool for characterizing their electrical performance. It visually depicts current output patterns across different voltages, reflecting the transport, collection, and energy conversion of photogenerated carriers. The curve’s nonlinear nature and key parameters (e.g., short-circuit current, open-circuit voltage, maximum power point) are critical for evaluating cell performance and optimizing system efficiency.
2. Segmented Current-Voltage Relationship in IV Characteristic Curve

The current-voltage response of PV cells is divided into two stages: forward characteristics (0 to open-circuit voltage UocUoc) and reverse characteristics (exceeding UocUoc). Their current behaviors and physical mechanisms differ significantly:
(1) Forward Characteristics: 0 to UocUoc
Voltage Range | Current Variation Feature | Physical Mechanism Explanation |
Initial low-voltage stage | Current slowly decreases with increasing voltage | The internal electric field efficiently collects most photogenerated carriers into current; rising voltage weakens the field’s driving force, causing a slight current drop. |
Approaching UocUoc | Current rapidly drops to near zero | The electric field’s driving force for carriers approaches zero, so photogenerated carriers cannot form effective current (current = 0 at UocUoc). |
(2) Reverse Characteristics: Exceeding UocUoc
Voltage Range | Current Variation Feature | Physical Mechanism Explanation |
Exceeding UocUoc | Current increases reversely | The internal electric field reverses direction, creating a reverse driving force for carriers; some carriers are collected in reverse, forming reverse current. |
High reverse voltage (optional) | Current surges sharply (breakdown) | Extreme voltage causes reverse breakdown in PV cells, abruptly changing carrier transport; cells do not operate in this region under normal conditions. |
3. Key Parameter System of IV Characteristic Curve
The IV curve’s core parameters include direct physical quantities (e.g., IscIsc, UocUoc) and derived calculated quantities (e.g., PmaxPmax, FF, RsRs, RshRsh). Their definitions, physical meanings, and calculation logics are as follows:
(1) Basic Characteristic Parameters
Parameter Name | Symbol | Definition & Physical Meaning |
Short-circuit current | IscIsc | Maximum current at 0 voltage, reflecting the highest collection efficiency of photogenerated carriers (all carriers contribute to conduction). |
Open-circuit voltage | UocUoc | Maximum voltage at 0 current, reflecting the exhausted driving force of the electric field (no effective current output). |
Maximum power point | MPP | The point on the IV curve where voltage × current is maximized, corresponding to maximum power current ImppImpp and voltage VmppVmpp. |
(2) Derived Test Parameters (Calculated During Module I-V Testing)
Parameter Name | Symbol | Definition & Calculation Logic |
Maximum power | PmppPmpp | Pmpp=Vmpp×ImppPmpp=Vmpp×Impp — the maximum voltage × current product on the IV curve. |
Fill factor | FF | FF=Vmpp×ImppUoc×IscFF=Uoc×IscVmpp×Impp — a core indicator of “voltage-current matching”; higher values mean better performance. |
Series resistance | RsRs | Calculated from voltage difference/current difference at MPP under 1000 W/m² and 500 W/m² (Rs=ΔVmppΔImppRs=ΔImppΔVmpp); may be negative (non-physical, due to test fitting). |
Shunt resistance | RshRsh | Slope of the dark current curve (no illumination) near zero current, reflecting the cell’s ability to suppress leakage current. |
(3) Temperature Coefficients (Environmental Impact on Parameters)
PV cell parameters are sensitive to temperature. Typical temperature coefficients reflect performance trends with temperature:
Parameter Name | Temperature Coefficient | Physical Law Summary |
Short-circuit current (IscIsc) | +0.04%/℃+0.04%/℃ | Rising temperature reduces semiconductor bandgap → enhanced light absorption → slightly increased IscIsc (weak temperature sensitivity). |
Open-circuit voltage (UocUoc) | −0.25%/℃−0.25%/℃ | Rising temperature intensifies carrier thermal motion → reduced electric field driving force → significantly decreased UocUoc. |
Maximum power (PmaxPmax) | −0.34%/℃−0.34%/℃ | The sharp drop in UocUoc dominates power changes → PmaxPmax and conversion efficiency decrease with rising temperature. |
4. Core Logic of Module I-V Testing
In PV module IV testing, only current (II) and voltage (VV) are directly measured; other parameters are derived from “data fitting and calculation during variable resistance”:
· PmppPmpp: Traverse all voltage-current pairs on the IV curve to find the maximum V × I point, corresponding to VmppVmpp and ImppImpp.
· FF: Calculated as the ratio of PmppPmpp, UocUoc, and IscIsc.
· RsRs, RshRsh: Derived from curve fitting of multi-irradiance (e.g., 1000 W/m² vs. 500 W/m²) or dark current tests.
5. Visual Interpretation of IV Characteristic Curve (with Schematic)
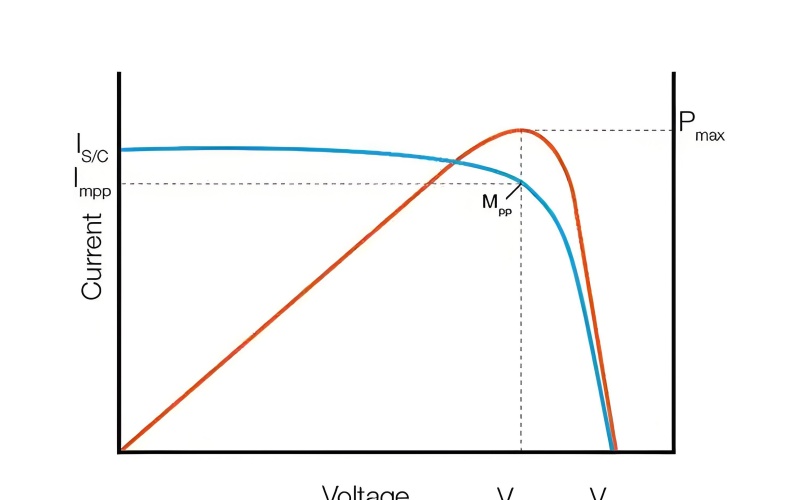
The figure below shows a PV cell’s IV curve under Standard Test Conditions (STC: 1000 W/m², 25℃, AM1.5). Key elements and their physical meanings are labeled:

Figure Explanation:
· IscIsc: Short-circuit current (maximum current at 0 voltage).
· UocUoc: Open-circuit voltage (maximum voltage at 0 current).
· VmppVmpp: Voltage at the maximum power point.
· ImppImpp: Current at the maximum power point.
· PmppPmpp: Maximum power (Vmpp×ImppVmpp×Impp).
· FF: Fill factor (visualized as the “rectangle” ratio of PmppPmpp to Uoc×IscUoc×Isc).
6. Practical Significance of IV Curve Analysis
Analyzing the IV characteristic curve enables:
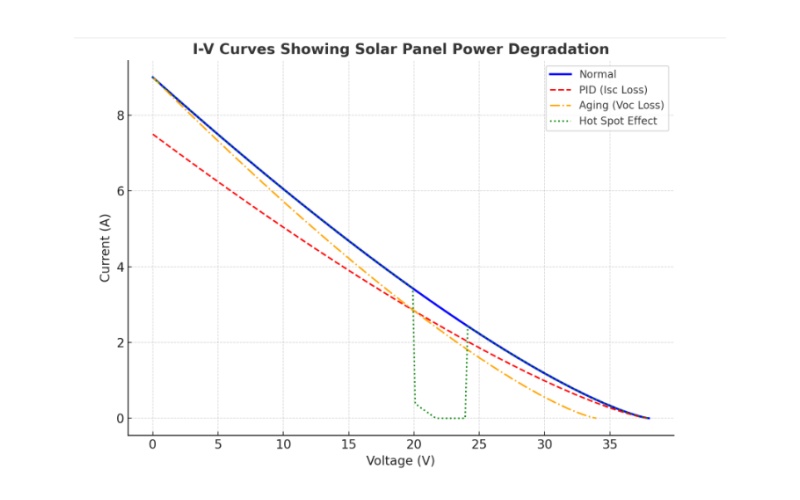
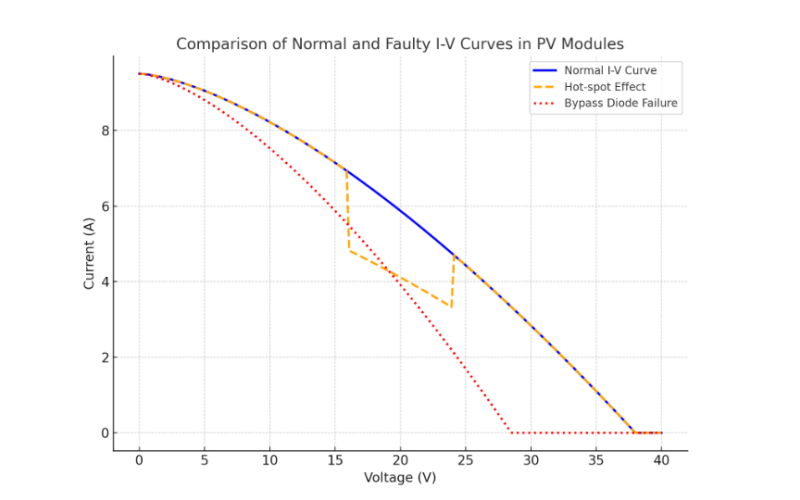
· Quantitative evaluation of PV cell performance (e.g., efficiency, loss mechanisms).
· Diagnosis of system faults (e.g., shading, aging, mismatch).
· Optimization of operating conditions (e.g., MPPT control to track MPP for maximum energy conversion).